Defining Search Opportunity: Dentist in Singapore
Whenever we have a new client the first task we undertake is to educate ourselves on the company and industry. A key part of this education is to understand what people are searching for on Google that connects back to products or services that the company could drive revenue from.
In order to give a practical example we ran a case study on dental practices in Singapore. The average dentist provides a wide variety of services and whilst some will specialise in certain areas, we found most could be categorised roughly into the following core offerings:
- General dentist
- Braces & retainers
- Fillings & root canal
- Whitening
- Veneers
- Extraction
- Polishing & scaling
- Dentures
- Crowns & bridges
- Kids
- Implants
Let’s dig into the findings we were able to produce for the dental industry here in Singapore, starting with a view of the search opportunity per month.
Building up a view of the market opportunity from search
In order to understand the market opportunity for a dentist in Singapore we want to go through a process called keyword research. In simple terms we are leveraging tools that help us to understand what people are searching for, and in what kind of volumes per month.
Our output from this task would be:
- A list of keywords related to dentistry that we can categorise into service offerings.
- The rough monthly search volume against each of those keywords and the total category opportunity.
Our research and subsequent analysis took around 5-6 hours to complete and we were able to identify 668 relevant keywords across the below categories. In the table below you will find a summed up view of the number of keywords and the search opportunity by category*
| Category | # Keywords | Monthly Search Volume |
|---|---|---|
| Braces & Retainers | 190 | 74,150 |
| General Dentist | 39 | 63,640 |
| Fillings & Root Canal | 132 | 29,650 |
| Whitening | 29 | 24,670 |
| Veneers | 57 | 23,740 |
| Extraction | 94 | 21,370 |
| Polishing & Scaling | 43 | 15,050 |
| Dentures | 39 | 8,820 |
| Crowns & Bridges | 11 | 7,930 |
| Kids | 16 | 5,820 |
| Implants | 18 | 2,770 |
*For the purpose of this article we did not include highly location specific searches in this category. For example “river valley dentist” or “dentist in north point” would not be captured in our dataset. Location searches are very important for such a service but we left these out for fairer comparisons across multiple dental clinics touched upon later in this article.
What can we conclude from the data at this point?
- From the 668 dental related keywords we can see there is roughly 277,000 searches occurring in Singapore per month. This equates to over 3.3 million per year. That is a sizeable market opportunity from Google search.
- 27% of the total search volume we identified belongs to people searching on the category of braces & retainers which includes well known products such as Invisalign.
- 23% of the total search volume belongs to generic dentist search queries such as “dentist in Singapore” or “dentist near me”.
How do we categorise the keywords in the first place?
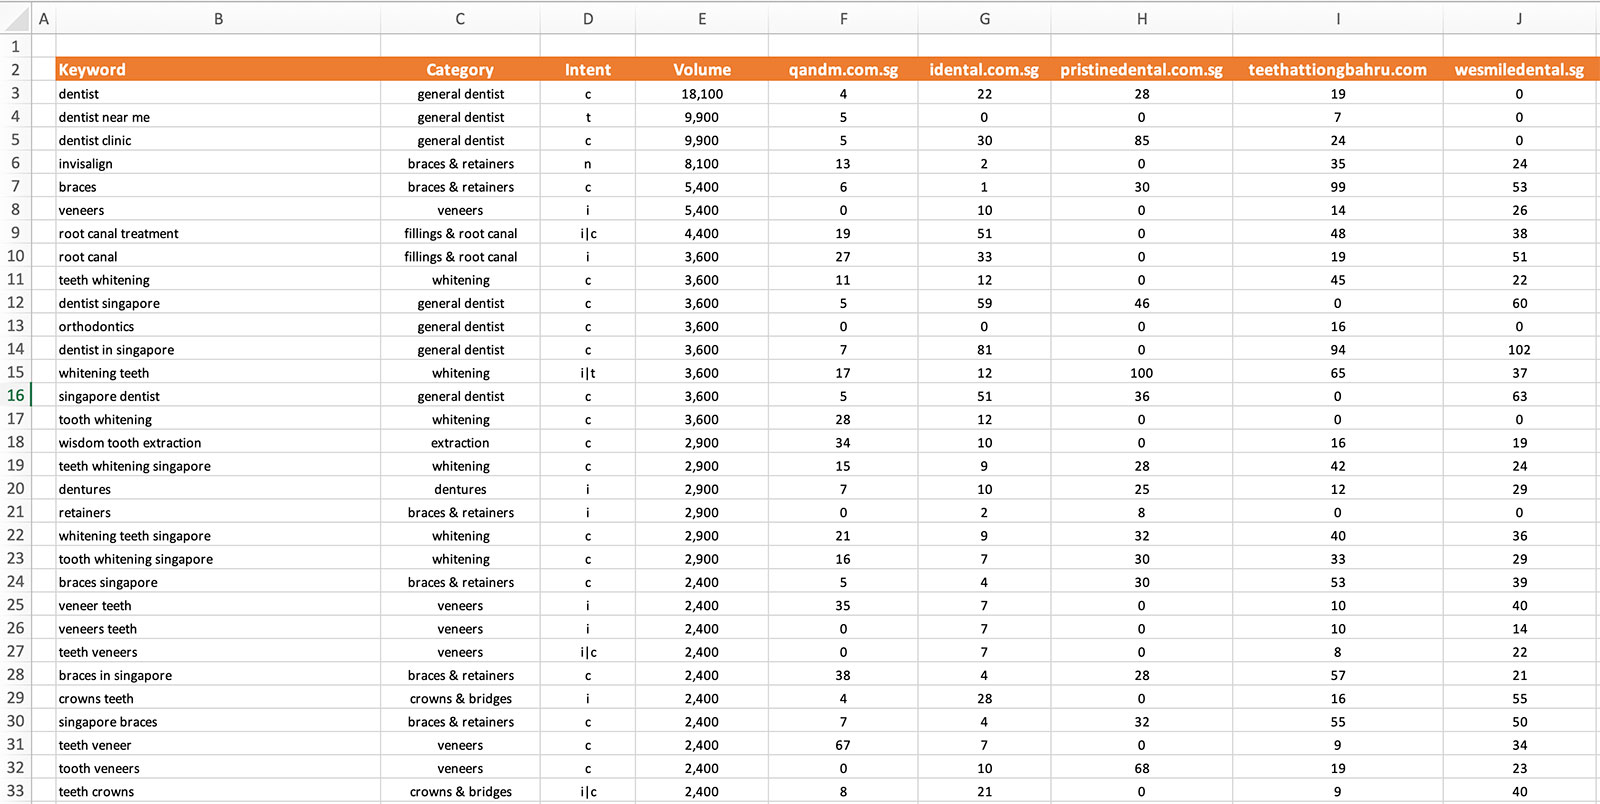
If you are wondering how we got to the above in the first place we basically extracted data from a rank tracking tool and compiled into a spreadsheet as shown below. This then allows us to provide a summed up view for each individual category.
- Column B are the keywords
- Column C the category we bucketed each keyword into
- Column D is a view of the search intent
- Column E the monthly search volume in Singapore
- Column F onwards are the rankings of various dental clinics against these keywords
Visualisation of a companies existing rankings
Now we know the market opportunity we like to visualise how a specific business is currently performing relative to that opportunity. In simple terms we want to show the owner of a dental clinic how well they rank on the keywords we have identified.
We went ahead and rank tracked 11 different dental clinics against our 668 dental keywords and then took one of these called Q&M Dental Group to highlight how it performs.
Firstly we can just look at the performance as an overview using the below visualisation.

What does this tell us?
- Q&M Dental shows on page 1 of Google for 19% of the 668 dental keywords we identified.
- They rank on page 2 for 15% of the keywords.
- They show up on page 3 or worse for the remaining 66% of keywords which means they have tons of opportunity for more upside.
Why do we like to categorise rankings by page 1, page 2, and page 3+?
- 70% of people searching on Google don’t make it past page 1. If you aren’t on page 1, you won’t get many visits.
- If a company is already ranking on page 2, small improvements could tip them onto page 1, so it’s potentially low hanging fruit.
- Page 3+ is effectively invisibility. Nobody will ever find you unless you are looking for yourself.
- Keeping it visually simple [as much as possible] helps with more simplistic story telling.
How do they perform in specific dental categories?
Going slightly deeper now we can also leverage our keyword ranking data to see how Q&M Dental Group are ranking within each category we identified. This is really useful to highlight potential strengths and weaknesses.
To visualise this dataset we are showing the number of keywords ranking on page 1, page 2, and page 3+ for each of the categories. The longer the total bar, the more keywords within the specific category.

Plenty of observations and opportunities quickly jump out from this, some of the more obvious ones:
- They have pretty good rankings on the general dentist keywords showing on page 1 for 33% of them.
- Extraction is also another strong category with them ranking on page 1 for 37% of those keywords.
- They also perform extremely well for searchers looking for kid friendly dentists. They rank on page 1 for 88% of those keywords, which is really excellent.
But they have plenty of opportunity upside to:
- Their visibility on fillings and root canal related search terms is really poor. They show up on page 3 or worse for 89% of the keywords in this category.
- They don’t show up at all for people looking for veneers despite the fact they do offer this service on their website [somewhat hidden in another more general aesthetics page].
- Polishing & scaling is also a popular search topic in Singapore, but they show up on page 3+ for over 70% of the keywords in this category.
- Anywhere we see green bars highlights keywords that may be more easily moved from page 2 onto page 1 and could deliver more immediate upside to the business.
Whilst looking at the data in this way is already very useful, we can add a further view by breaking down Q&M Dental visibility across page 1, 2 and 3+ in relation to the monthly search opportunity. The longer the bar, the greater the total search opportunity within the specific category.
This view is useful because it negates the situation where you may rank on page 1 for lots of keywords only to find you’re not ranking on page 1 for the keywords with the most significant opportunity.

Again, we can spot plenty of insights here:
- They are extremely well placed on general dentist keywords being visible on page 1 to some 50,000+ searches a month. They rank on page 3+ for keywords in this category which sum up an additional 11,000 searches per month.
- There is over 23,700 searches a month in Singapore around Veneers, but Q&M Dental currently have no page 1 or page 2 rankings for this category. They could probably address this quite easily from what we can see.
- The whitening category looks very interesting. They rank on page 1 for 1 keyword with 110 searches per month, but they rank on page 2 for 14 keywords that make up 15,000 searches per month. It may be easier for them to get onto page 1 for some of these keywords in the shorter term.
- The same can be said for other categories where there is green bars evident. This is all search opportunity that exists where the clinic already shows up on page 2. Page 1 is not that far away!
You can also view this data across competitors, which is really powerful
One of the other things we really like to visualise is how a business compares to a clutch of competitors within a market. This can be particularly powerful when talking to a business owner because you can reinforce the reality of the current situation, but also show that if a competitor can achieve this, then so can they with the right focus and investment.
As a last illustration we can show multiple competitors to showcase which dental clinics are obtaining good rankings and which are not. The graph below outlines the % of keyword rankings each dental clinic has on page 1, page 2, and page 3+.

How would you read this?
Theres many observations you could take from this data but let us just pick some quick examples.
- iDental and No Frills Dental are the clear winners here in terms of overall visibility on page 1. iDental shows on page 1 for 44% of the 668 keywords we selected, whilst No Frills Dental is at 40%. Kudos to them for some fine work there.
- There remains tons of opportunity for all clinics however as even our best performers have more than 40% of keywords on page 3+ of worse [i.e., they are invisible].
- We also included an extreme example called Arkindental [an excellent dentist by the way at Great World City – no affiliation] just to highlight that theres plenty of clinics out there who have almost no visibility today in search and probably still attract location based leads within the local vicinity. They are however missing a much greater opportunity based on the volume opportunity we identified in our research.
You could take it one step further
For the purposes of trying to stay somewhat concise we will not delve into too much detail here, but once you know the search opportunity, you can also make some estimations on traffic impacts should your dental practice rank better on a set of keywords.
When you know the visits, you can in turn run some additional maths:
- Conversion rate from visit to lead
- Conversion rate from lead to client
- Average revenue from client for specific service
If you build this model you can calculate estimated revenue impact on the business from improving your search rankings.
Thank you for reading, we hope it was insightful.
